Analytics
Our analytics section is designed to offer you detailed insights into your AR and 3D web visualization projects. Understanding these metrics will empower you to engage your audience more effectively, optimize your content, and ensure successful integration on your website.
Below we describe each portion of the analytics section providing tips for leveraging these insights effectively.
Access to Analytics
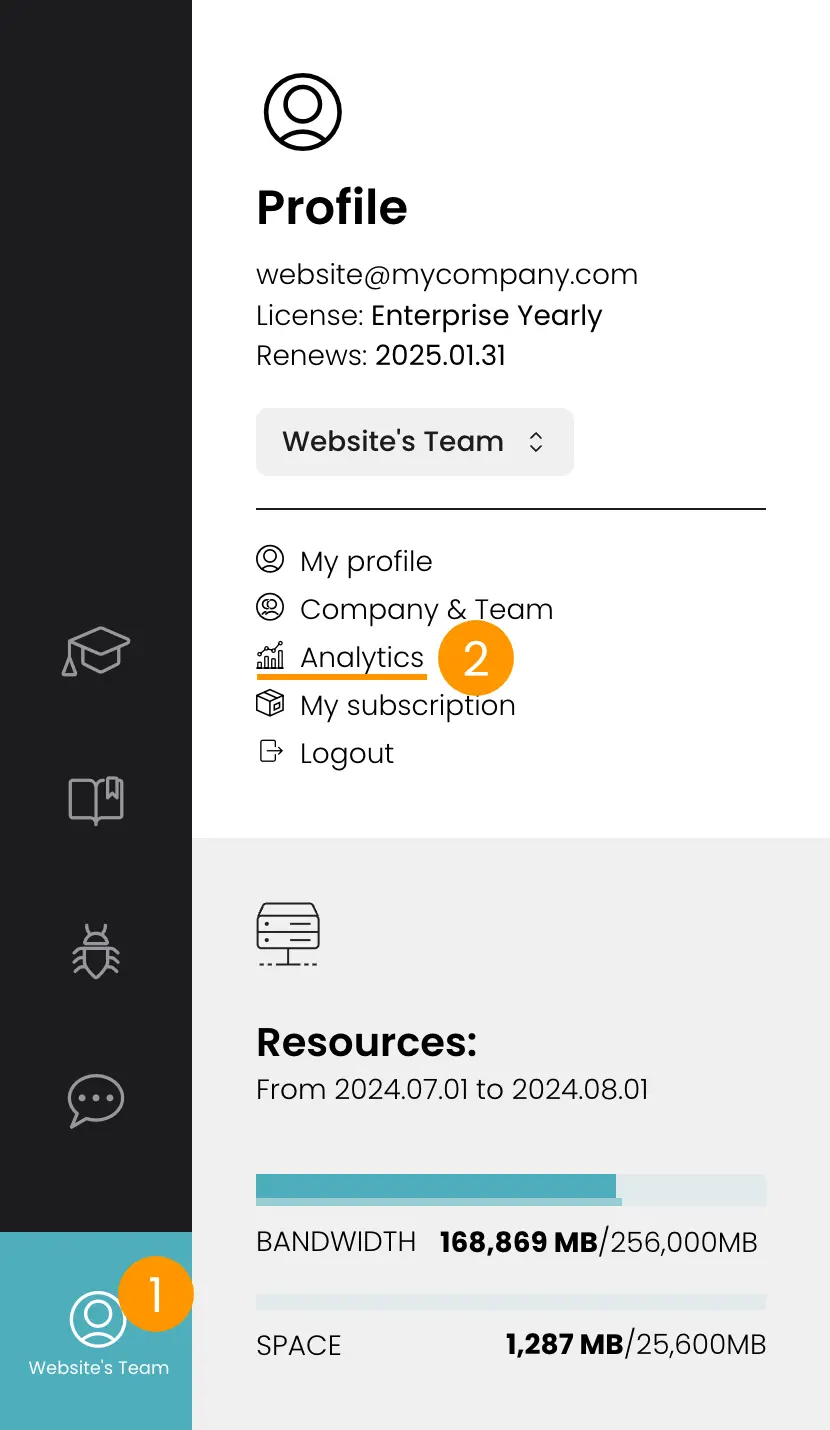
To access the Analytics, click on the user profile icon 1 and click Analytics 2.
Views Graph - Enhanced Interaction Tracking
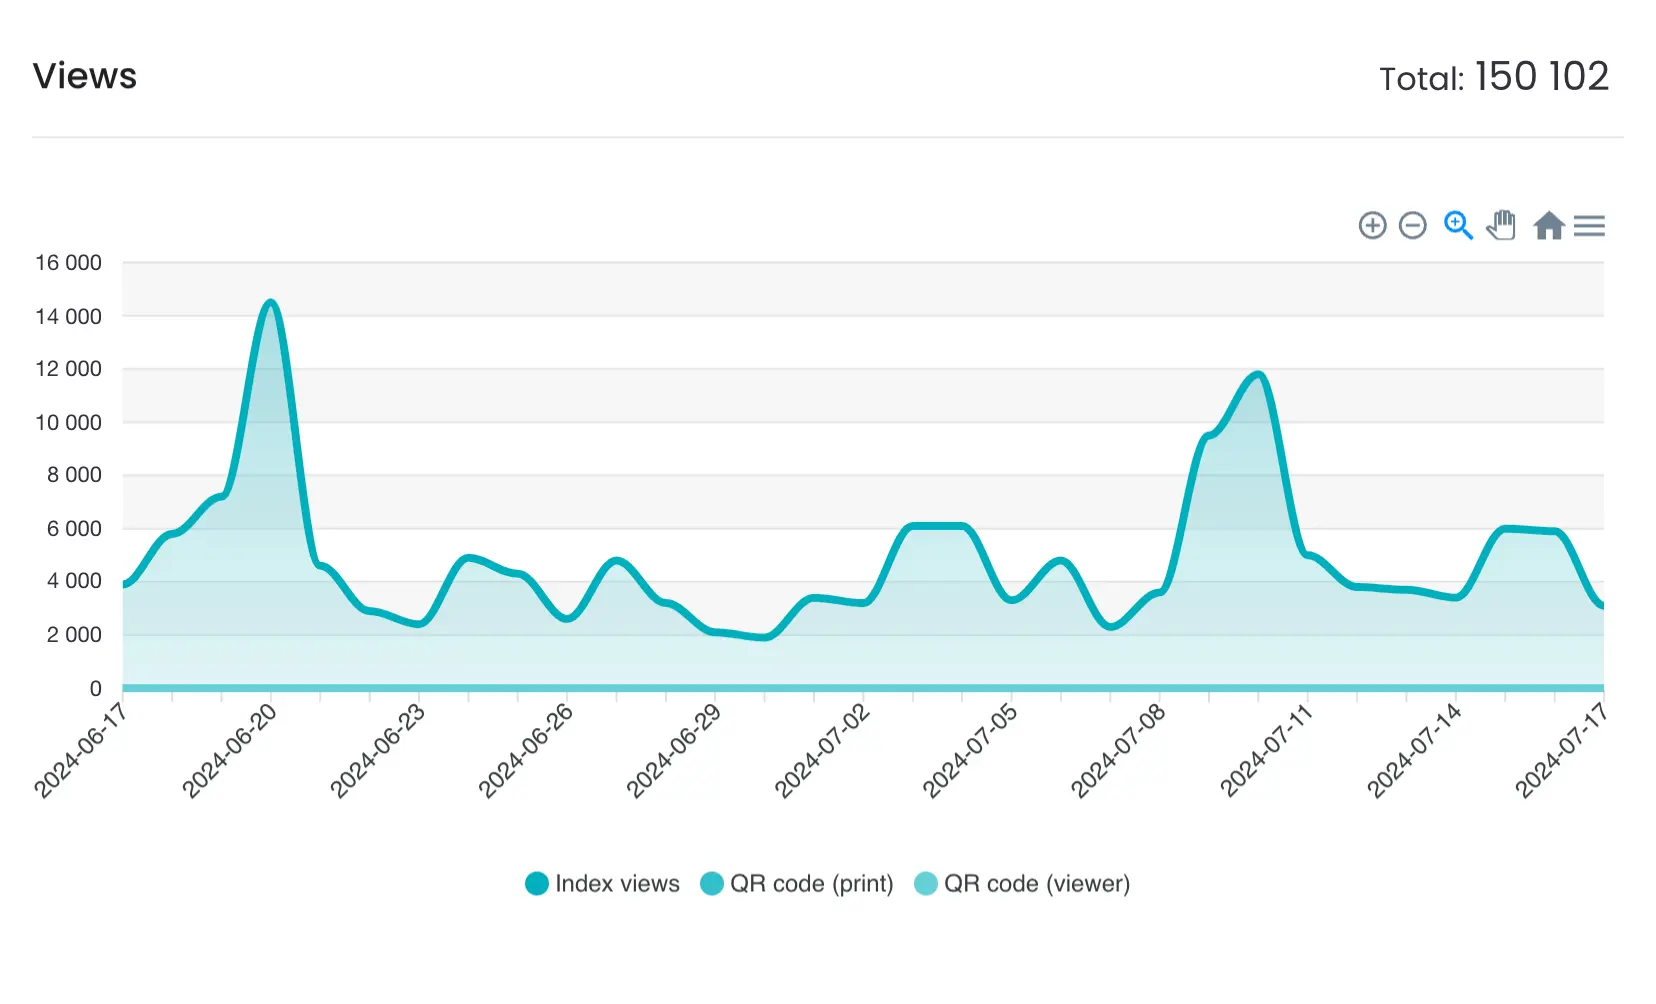
This graph presents the number of views your content receives over a specific period. It highlights user engagement patterns and the effectiveness of your promotional activities. The Views Graph not only displays the total number of views but also provides insights into the sources of these views.
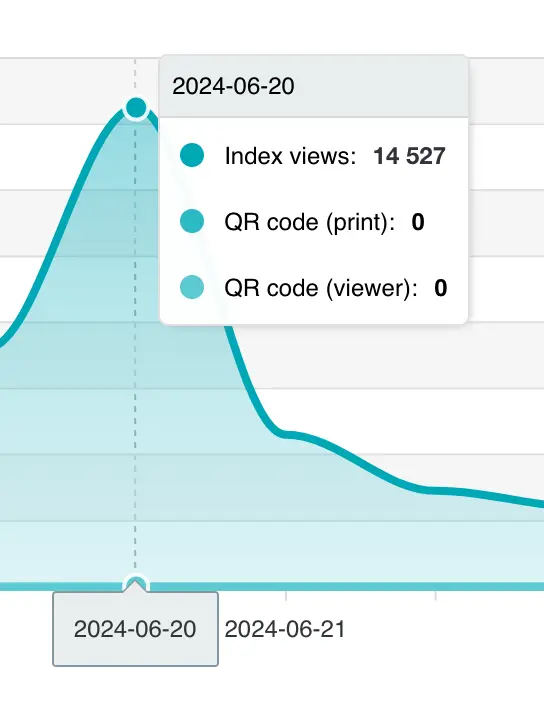
With a hover-over feature, users can see a breakdown of the views, differentiating between 'Index views' and views generated via 'QR code'. This allows for tracking of how users are accessing the content, whether through direct online navigation ('Index views') or by scanning QR codes placed on printed material.
Usage Tips:
- Analyze peaks to understand high engagement drivers.
- Investigate troughs for potential content or technical issues.
- Track engagement trends in relation to marketing efforts.
- Utilize the hover-over feature to understand the effectiveness of QR code distribution in print materials.
- Monitor the QR code usage to evaluate the success of offline marketing campaigns in driving online engagement.
- Consider enhancing print materials with QR codes if the tracked views from these sources are low, to create a seamless bridge between physical and digital content.
World Map and Views by Country - Interactive Data Display
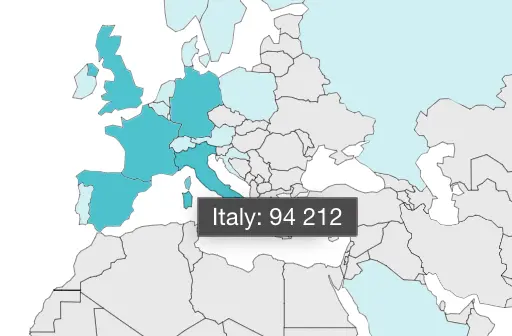
These features visualize the geographical distribution of your audience, allowing you to see where your content is most popular. The World Map enhances your understanding of global audience engagement by providing an interactive display.
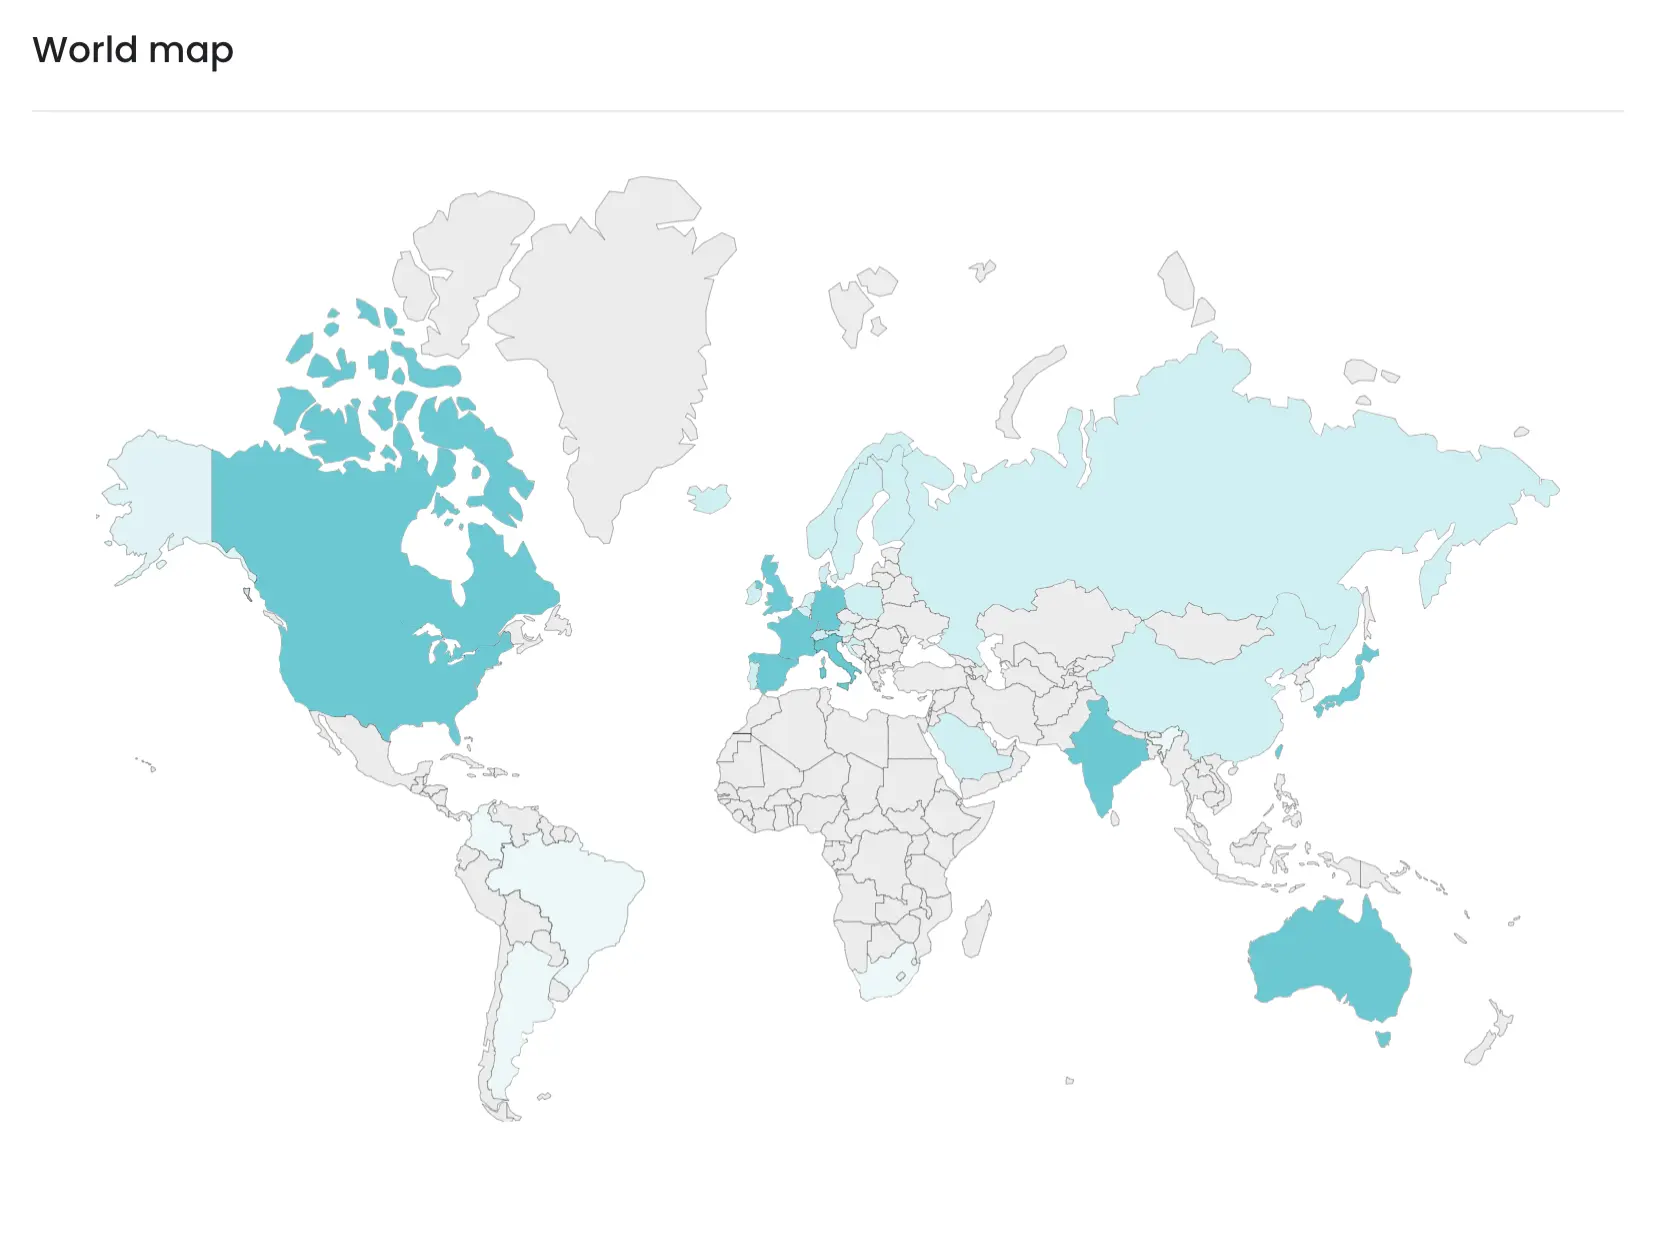
By hovering over any country on the map, users can see the exact number of views from that location. This interactive element allows for a quick and intuitive assessment of geographic data.
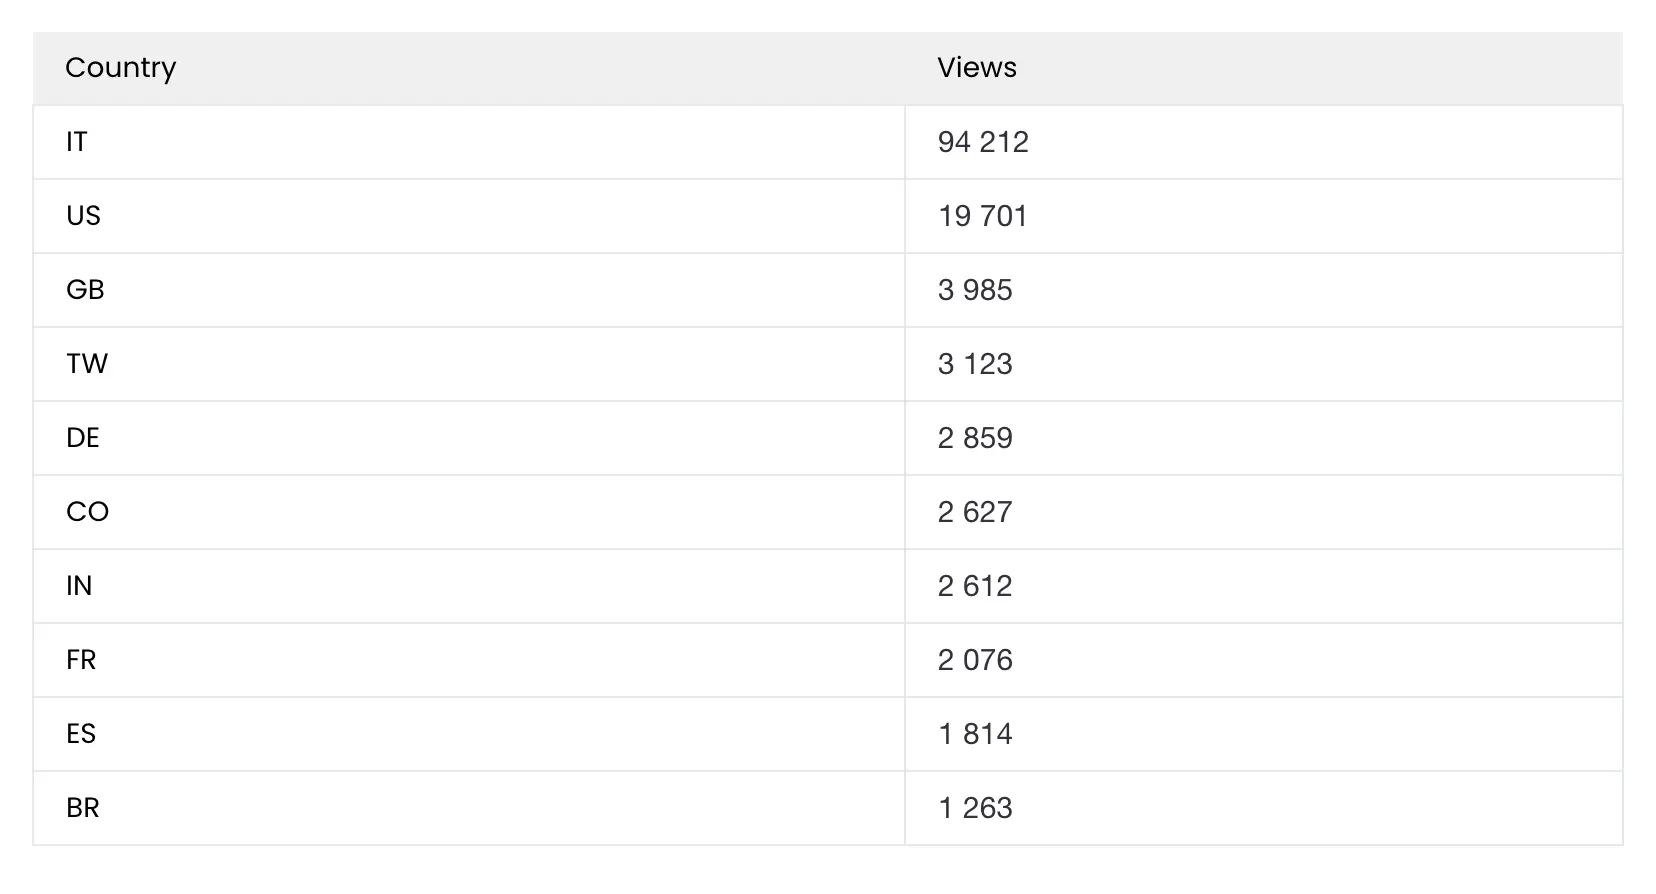
In addition, a table shows the 10 countries that performed the most views.
Usage Tips:
- Direct marketing resources to countries with high engagement.
- Localize content for audiences in emerging markets.
- Adapt strategies to increase reach in lower-engagement regions.
- Hover over countries on the map to see a quick view count without referring to the table and use this interactive feature for presentations or reports where visual data representation is beneficial.
Top Projects and Configurations
Get to know which of your projects and/or configurations are resonating most with your audience.

Top Projects 1: this section refers to the collections of models (projects) that have been created and tracks the sum of the view count of all the models contained.
Top Configurations 2: on the other hand, this section outlines the individual models (configurations) and tracks their view count. These represent the specific AR or 3D assets that users engage with.
Usage Tips:
- Analyze Top Configuration to understand which individual models are most attractive to your audience.
- Prioritize updates to your most popular content.
- Leverage successful features in new projects.
- Customize content strategies based on performance data.
User Agents, Device Types and Operating Systems
This section offers an in-depth analysis of the various browsers (user agents), device types (desktop vs. mobile), and operating systems that your audience uses to engage with your AR and 3D content.
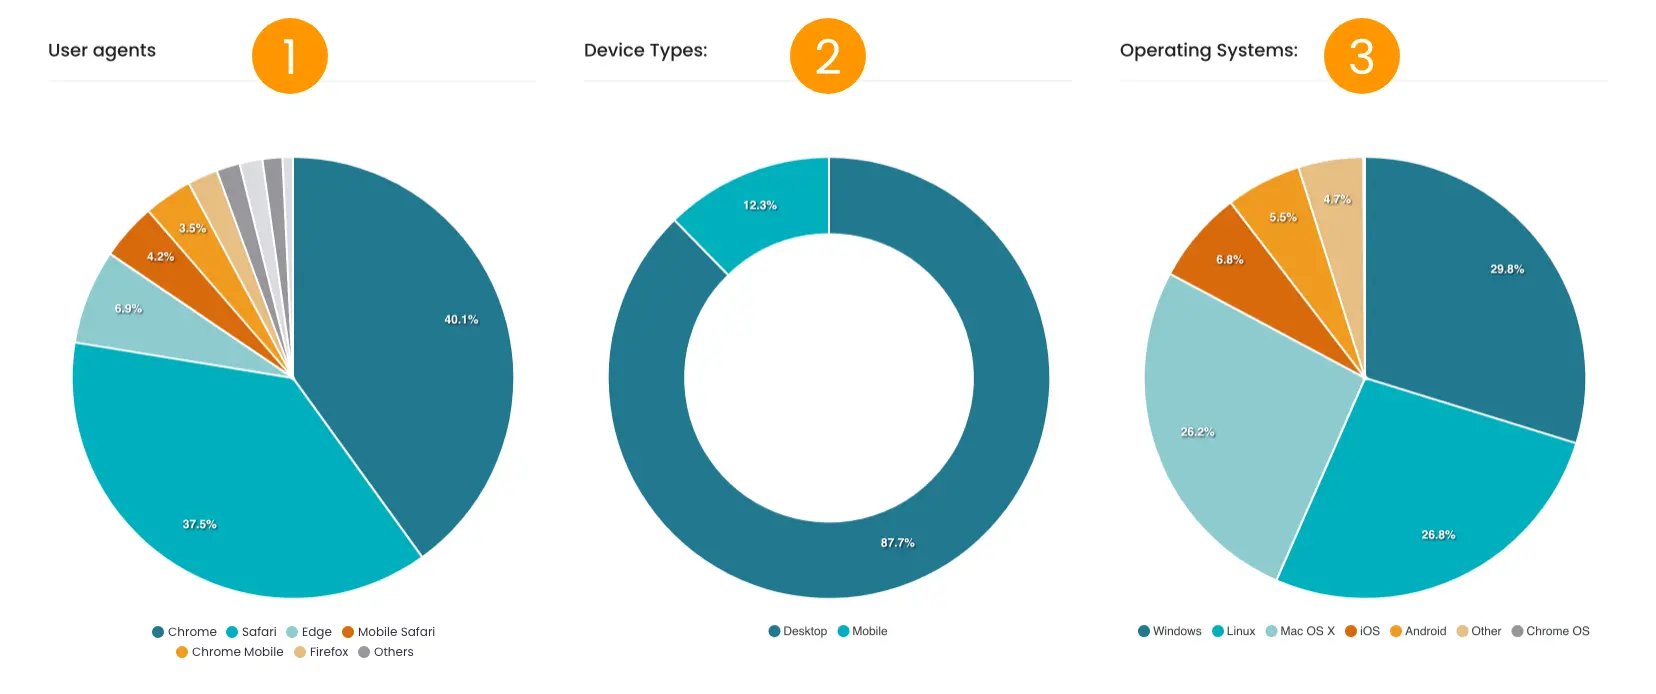
User Agents 1: Indicates the popularity of browsers among your audience.
Device Types 2: Shows the preference for desktop or mobile when accessing your content.
Operating Systems 3: Highlights which operating systems are most used among your users, providing a layer of detail beyond device type.
Usage Tips:
- If analytics indicate a significant desktop audience, remind users that they can switch to a mobile device for an enhanced AR experience by scanning a QR code.
- Consider developing how-to guides or prompts that encourage desktop users to switch to mobile for AR functionalities.
- Keep the mobile experience at the forefront of your AR content strategy, as it is the primary platform for AR engagement.
Bandwidth Used - Detailed Daily Analytics
The 'Bandwidth Used' section provides a daily breakdown of the traffic generated by the viewing of AR and 3D web content.
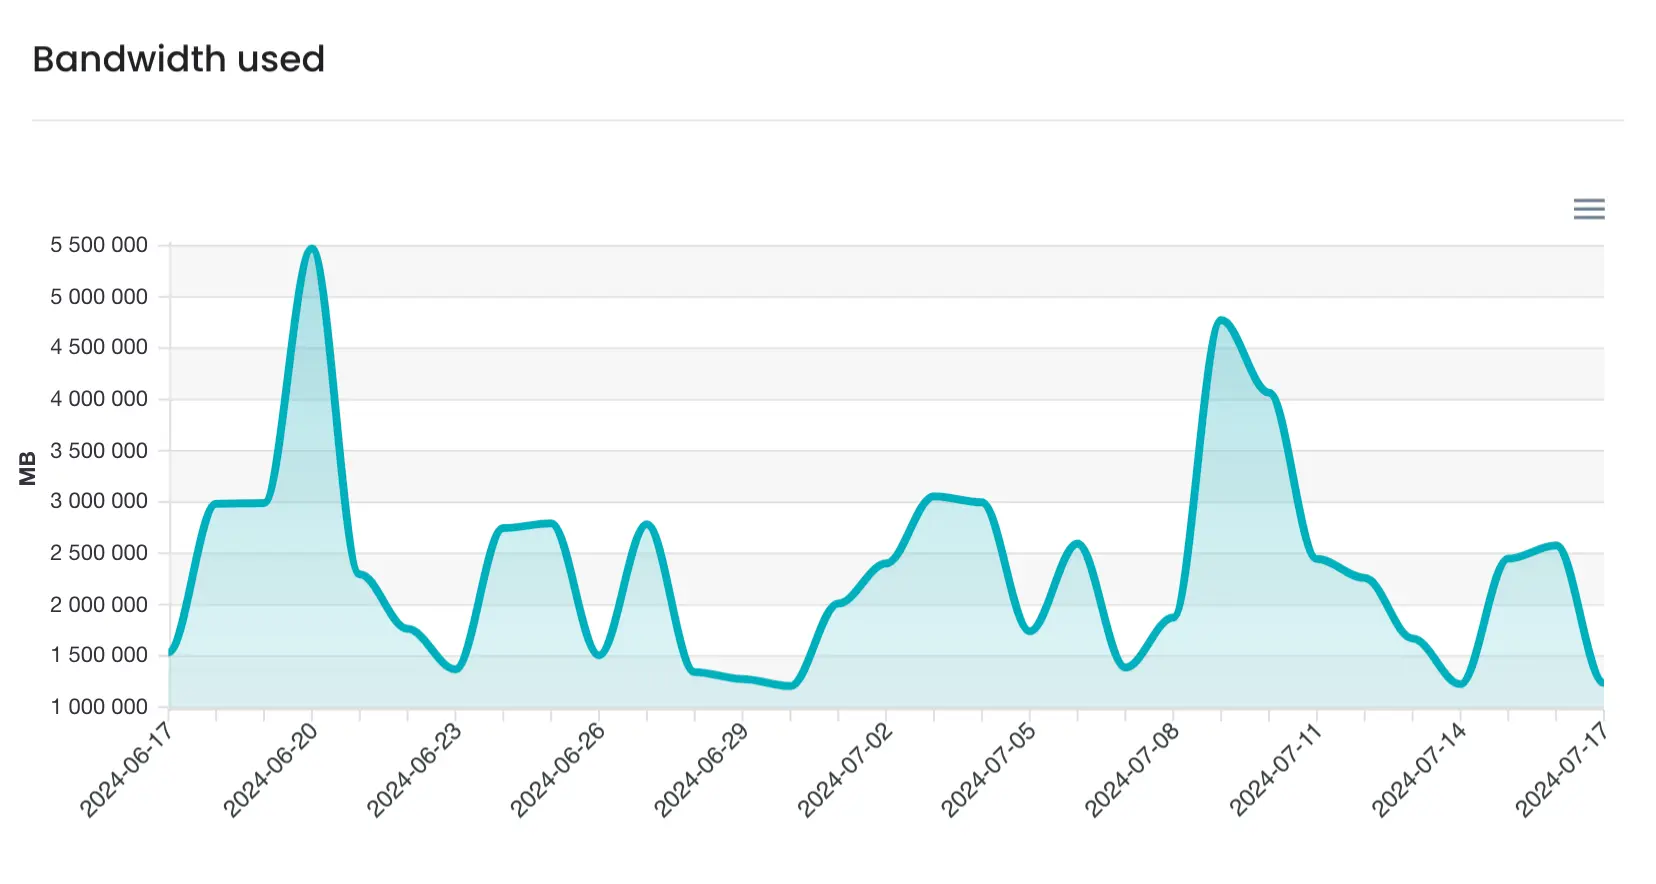 This complements the information available in the profile tab, which also includes storage data. The detailed daily analytics enable you to track how much data your content consumes, which is crucial for managing resources and costs.
Usage Tips:
Regularly review bandwidth usage to identify any spikes and assess whether they correspond with increased user engagement or are due to inefficiencies. Work on optimizing your content's file sizes, ensuring they're as small as possible without compromising on quality, to minimize bandwidth costs.
Optimizing 3D Asset Files:
To maintain an efficient and cost-effective AR experience, it's crucial to optimize your 3D models. Larger, more complex files consume more bandwidth when downloaded or streamed by users, which can lead to higher operational costs and potentially slower load times, affecting the user experience. Implement recommended optimization techniques such as reducing polygon count and textures.
Remember, efficient 3D models not only ensure quick load times and smooth interaction but also help keep your costs down and make your AR content accessible to users with various bandwidth limitations. Visit our guide for step-by-step instructions and tips on creating high-quality, bandwidth-friendly 3D assets.
Date Filter and CSV Data Export
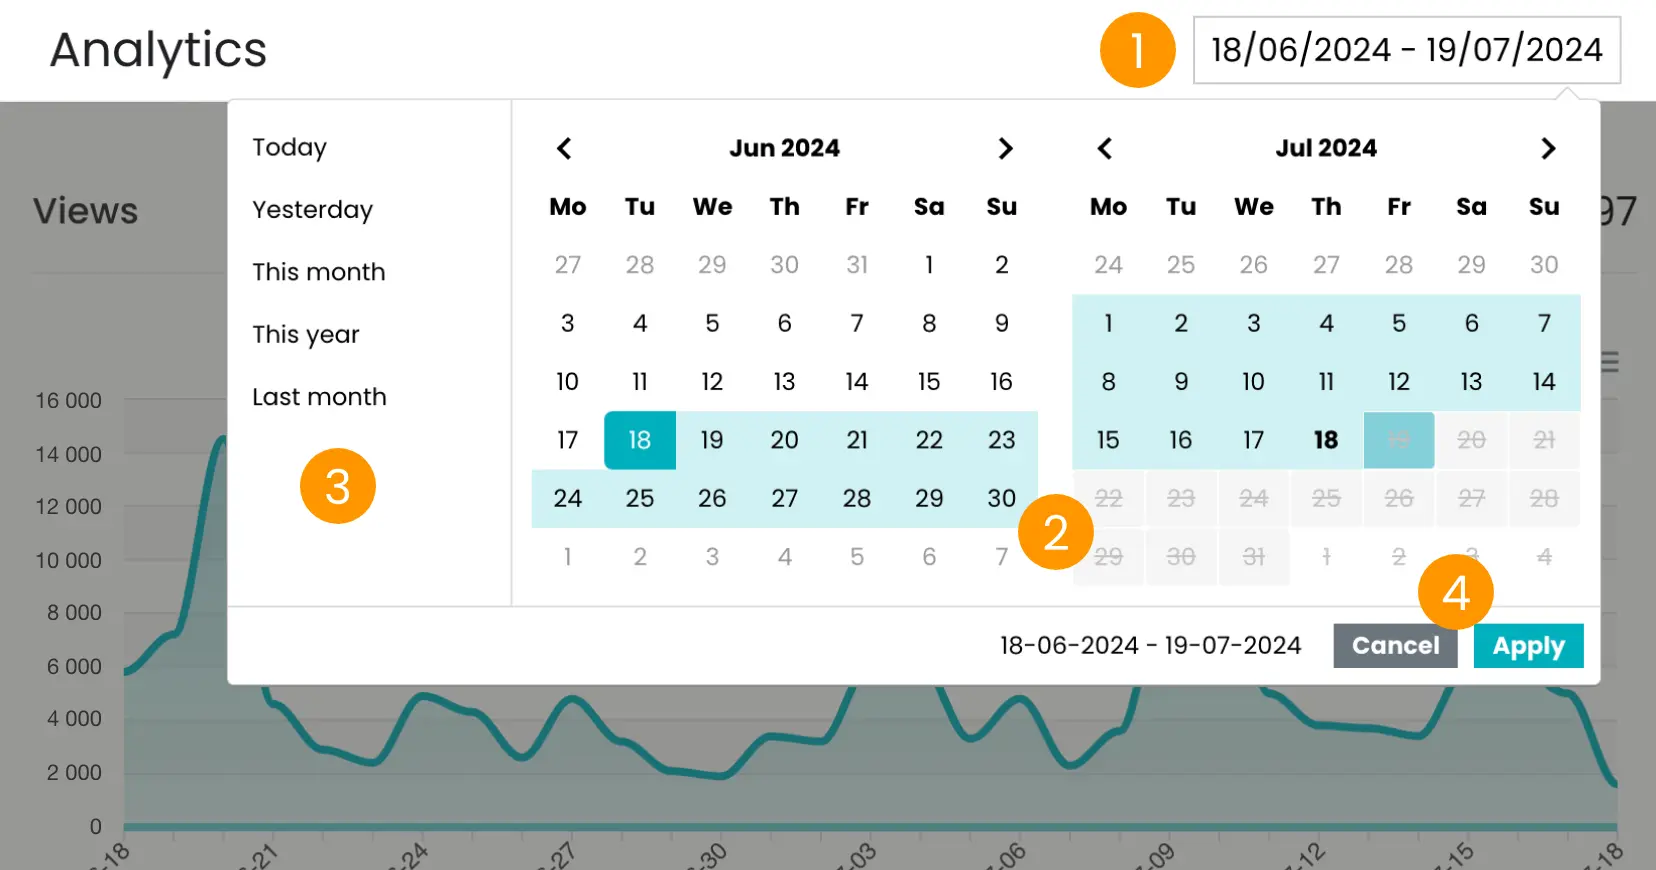
The date filter allows for analyzing data from selected time periods.
Open the date filter by clicking on the top right date range indicator 1.
Select a date range by clicking on the calendar 2 or select a preset on the left 3.
Remember to apply the filter 4.
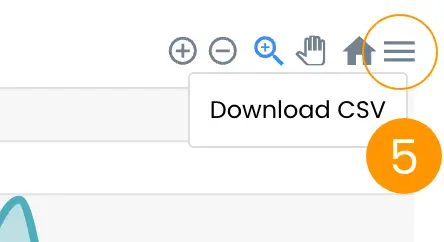
The CSV export feature 5 enables downloading data for more detailed offline analysis.
Usage Tips:
- Use the date filter to perform targeted analysis around specific campaigns.
- Export data to build an extensive dataset for advanced analysis.
- Share CSV files with team members for collaborative decision-making.
By integrating these analytics into your strategy, you'll be conducting a proactive ex ante analysis—optimizing your content distribution and improving user experiences with AR and 3D visualization. Our analytics dashboard is not just a reporting tool; it's a gateway to enhancing user engagement and making strategic decisions that will benefit your projects both now and in the future.